Geomob Edinburgh June 2024
Geomob Edinburgh June 2024
The Edinburgh Geomob met again on Tuesday the 25th of June 2024 at Codebase, in the shadow of Edinburgh Castle. Since the first session in March was so engaging, I had been looking forward to this one even more. Thanks always to Gala Camacho for fostering a relaxed and welcoming community.
Geospatial tech is for me not a career but a hobby. Despite (or maybe because of) that it’s the tech meetup that I get most excited about. Every visit expands my horizon of the interesting problems that are out there and how open data and tools help solve them. Some of the technical details and jargon go over my head, and that’s fine. My own niche of security and cost engineering in AWS could be just as confusing to someone not immersed in it.
Maps are as much about understanding how we relate to each other as they are about physical measurements.
Just as important as the talks themselves is the mingling. It’s all about sharing stories and tech gossip! From one attendee I learned of the Scottish Tech Army, a not-for-profit organization that brings together NGOs and volunteer techies to help the third sector improve its understanding and use of technology. He lent his skills to a project that assists newly visually impaired people with audio cues to maintain their mobility and confidence.
The rest of the post sums up my notes and thoughts sparked by the three talks.
Steven Kay kicked off the session with his explorations of Orthogonal Strip Maps.
The London Underground map is probably the most famous modern example of a schematic map. It throws out almost everything you might expect a map to show. It ignores real curves and distances between stops. But with one notched line it answers the most important traveller’s question: where can I go from here?
It’s obvious in the 21st century, but its realization took a creative leap in the 20th, and builds on the idea of an orthogonal map which goes back centuries.
The earliest orthogonal example Steven showed was a page from Paterson’s Itinerary (Volume 2, maps 113-114), published in 1785. It shows the road route from Cambridge to Ely, and optimizes the layout for a traveller marking progress from one place to the next.
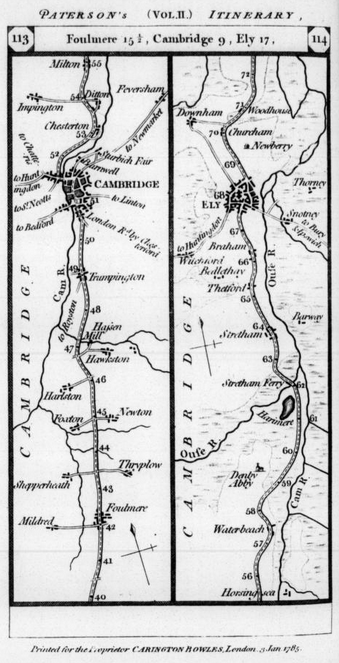
It draws the route from top to bottom, split into two vertical strips to give more space to details along each half of the route. You read down from Cambridge on the left and up to Ely on the right. Most maps put north at the top. This one has a compass to show that the route runs south-south-west. It draws and names settlements close to the route, but the side roads to reach them are faint. The main route shows mile markers to estimate travel time and plan rests. It retains curves in the road and nearby rivers that may serve as navigational aids.
A more recent example is Daniel Huffman’s 2015 linearized map of Lake Michigan. He illustrates the basic idea:
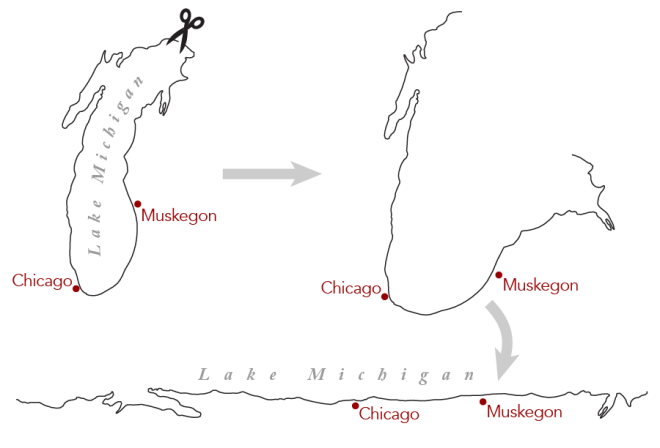
See Daniel’s article for the complete map. It’s beautiful and reveals how much humans organize around water. He gets into more history of such maps, and deep into the why and the how of his own effort.
I won’t attempt to reproduce the math needed to draw Daniel’s map, because even he admits that he no longer understands it (a friend helped). Although Steven’s own equations were much simpler, he got a similar result, and it’s still pleasant to look at.
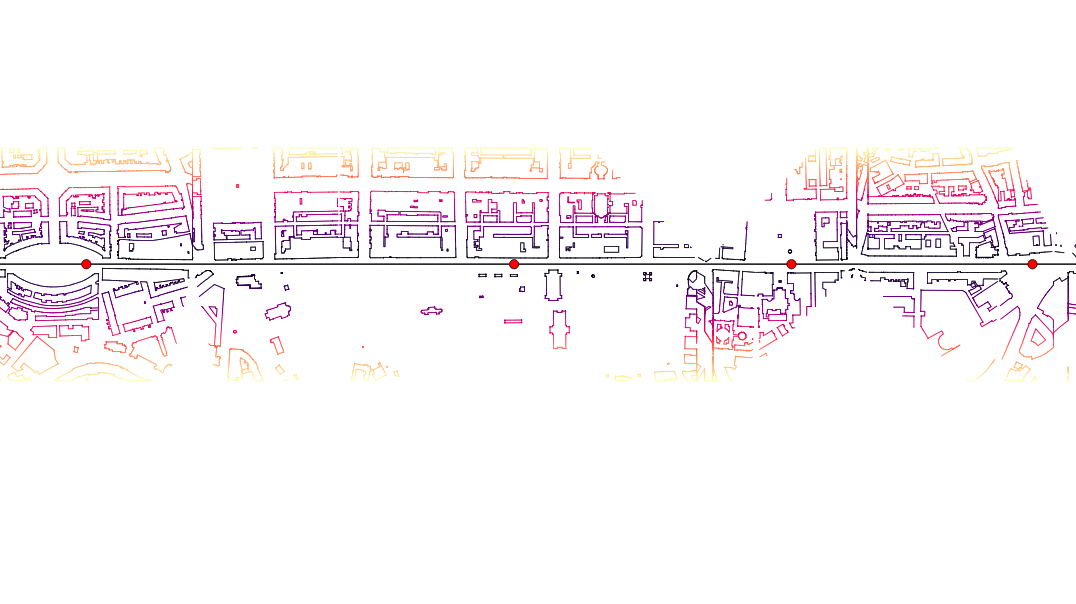
Steve’s basic approach is to take a strip of the map on each side of the route and lay them out in a straight line.
The V-shaped artifacts indicate where a right-angle turn has been flattened out, as if diagonally cutting an L shape and laying each part flat.
I imagine Daniel’s more complex equations are what avoid such artifacts in his version. Also Lake Michigan doesn’t have any sharp corners.
One of the audience asked about scaling each segment of the displayed route to the expected speed, so that you may have greater levels of detail for areas where you spend more time (slower parts would have bigger segments). The speaker thought it might be worth exploring until another in crowd countered: “Do you really want to see that much of Princes Street!?”
Apart from the visuals, the takeaway here is that it was all possible using data from OpenStreetMap (with a little manual cleaning) and open-source tools such as QGIS for the mapping and Blender for some animations.
One more miscellaneous detail: The Ordnance Survey published an open data product called OS Open Zoomstack that now competes with OpenStreetMap. I wonder which use cases it would be better fit for and how compatible it would be with OSM. There’s a whole other research topic!
Chris Fleming next gave us a retrospective of 20 years of OpenStreetMap: Why we’re still mapping.
Chris is a local legend of open mapping. Always enthusiastic, warm, and welcoming to newcomers like me, and always finding new ways to make OpenStreetMap (OSM) more useful for people.
And how useful is OSM for people in 2024? Chris suggested Strava, Instagram, Pokémon Go, and Cycle Travel. (That last one was new to me, but it looks great!)
I laughed when Chris told how one Pokémon Go player added a pond to his back garden in OSM so that he could catch more water pokémon. It’s such a popular game hack that the OSM Wiki now gives tips to do it responsibly, considering the needs of other map users.
In the early days Chris turned to Linux User Groups to find early evangelists and volunteers, because they already understood the value of open source development.
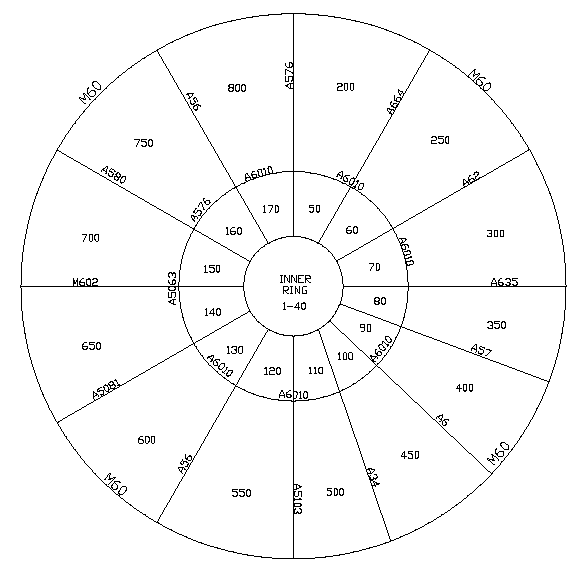
The first UK “mapping parties” brought people together to map city centers. To help divvy up the work they would split a city’s neighborhoods using a “cake diagram”. The Mapping Cake Diagram for the Manchester Mapping Party 2006 is even pleasingly circular.
Between 2007 and 2011 Yahoo allowed OpenStreetMap to trace its satellite images for maps. The OSM Wiki lists several achievements that would have been almost impossible at the time without it. The agreement continued until Yahoo shut down its mapping unit.
By time I had started contributing to OSM in 2013 through the Humanitarian OpenstreetMap Team (still active now), I recall that Bing had a similar arrangement.
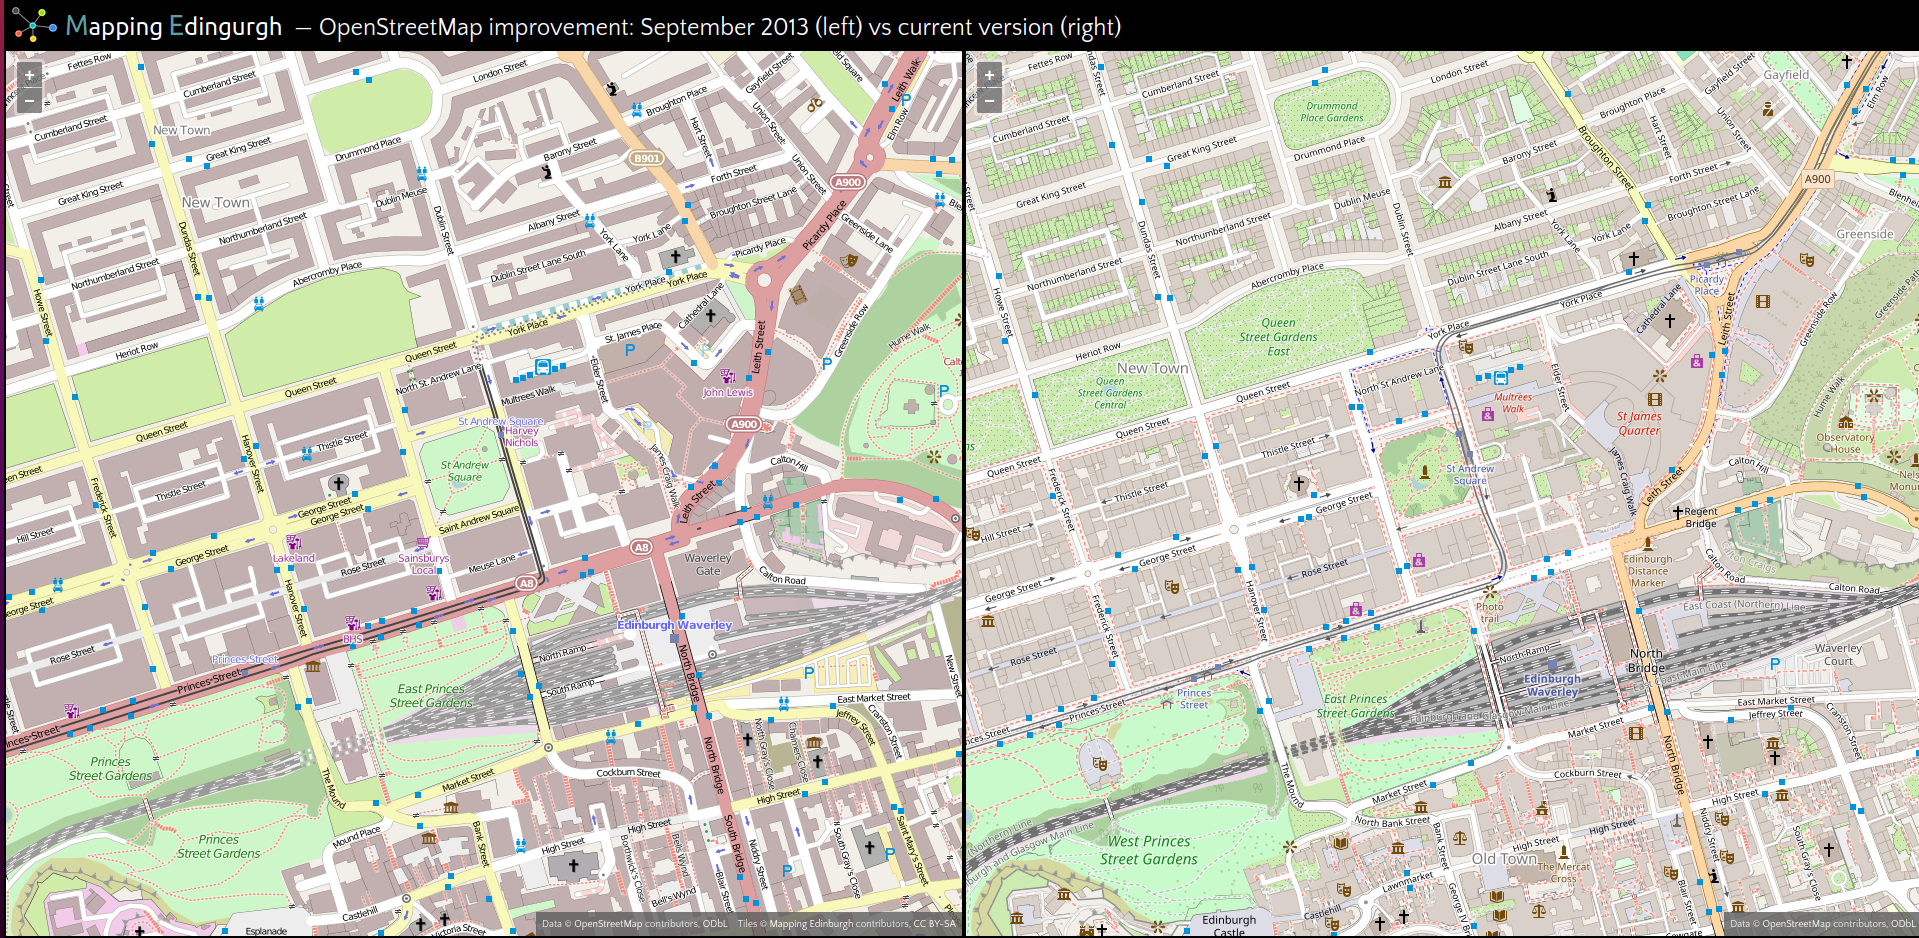
By 2012 OSM had mapped 95% of Scotland’s roads. At this point Chris showed us some screenshots of Edinburgh’s city center to compare 2013 and 2024. Although 2013’s maps seem crude and sparse now, the Scottish team deserved to be proud to get that far.
I think Chris used the OSM Comparator from the Mapping Edinburgh Toolkit. Today its view of Edinburgh looks like this:
By now the map was complete enough to support analyses in other fields such as a survey of medical occupations in 1909 and 1910.
Since then the level of detail has only increased. Almost all the street addresses are numbered. In one area someone even mapped out all the plant pots and trees. At some point you have to stop and wonder how much detail is too much!
But then, it all depends on the use case. What might be mapjunk for one person may be a critical navigational aid for another. Chris like me is sighted, and so we can’t always anticipate how visually impaired people may think about the world. I may have thought that tracking the kerb heights of all pavements was makework for bored mappers. Then Chris shared the story of a blind OSM user who asked for more of that data, because it helps him to walk around new city streets more safely.
Since I discovered OSM in 2013, smartphones have taken over the world. A new generation of mobile-first mapping tools such as Every Door and Street Complete are now available in our pockets at all times to fill in the small details that you don’t get from satellite images or GPS traces. When I tried Every Door in my local area, it set up 100 “quests”, such as identifying a road surface or the denomination of a place of worship. Geodata comes from the real world, and these tools make it easier to collect while you’re out there.
The Edinburgh OSM user group meets monthly. The OSM wiki shares details of the next events.
Tristan Goss from Earthwave increased the scale with cs2eo.org, which provides intersection processing for glaciological satellite altimetry.
The polar ice is melting at a rate of 1.2 gigatons per year.
We know this because of CryoSat-2, a European Space Agency (ESA) satellite dedicated to measuring polar sea ice thickness. It launched in 2010 with a 3-year mission. 14 years later, it’s still sending 1TB per month of measurements.
Tristan’s team uses that data to build a website called cs2eo, which serves “High performance geospatial-temporal queries for Earth Observation”. It allows you search over regions of the polar ice caps within a time range to get all the relevant ice height measurements captured by the satellite.
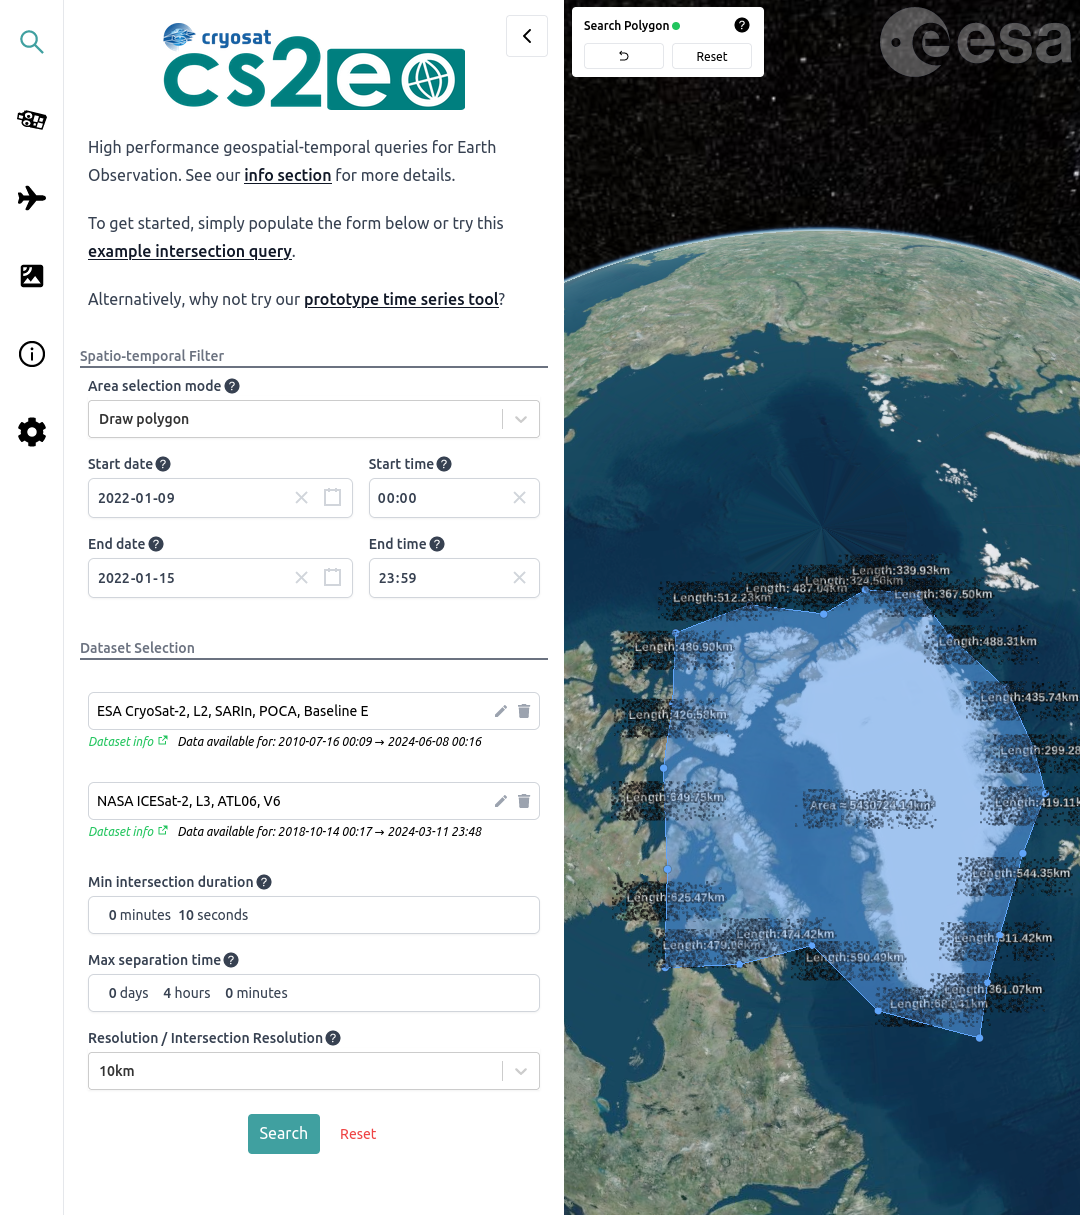
If you sketched all the approaches the satellite makes over the poles, you would draw lots of lines in random directions getting close to a central point. Only some intersect. The cleverness that Tristan’s team brings is to correlate these “strips” of data into something coherent for analysis.
Tristan looks forward to the new mission CRISTAL (Copernicus Polar Ice and Snow Topography). When the audience asked which instruments he would like a new satellite to have, he wished for one magic satellite with colocation of all the sensors! He also admitted it may cost more than the GDP of a small country, so it depends on how far the mission budget stretches.
The generalization of this use case is point cloud analysis. Tristan would like to correlate the data with other big-scale sources where each point lies kilometers from the next. Earthwave’s Specklia service exists to enable this for more use cases.
Funding for the polar project is hard to get because so few people live there. So if you want to support Tristan’s work, move to Svalbard.
Thank you to the Hanging Bat, Diagonal and OpenCage for hosting the geobeers and geobanter.
Over a pint of Leith Pils I heard about a Discord server for the Scottish tech community. I wonder, is it the one run by the Scottish Technology Club? That Club site looks like a great source for local tech news and events. They also have a mentoring program. Either way, I need to join and find out.
If any of this sounds fun, come to the next Geomob, probably in September or October. Watch the Geomob website for updates.